Excel tools you may not be using
Who doesn't love a multi-tabbed, 5000 line spreadsheet full of all the data you could ever analyze? We do!
But are you creating a living, breathing, modifiable document or just a nicely formatted, typed manuscript? And are you wasting time on features that are already automated for you?
Excel has more features and functions than most of us can ever use, but when it comes to financial work, here are a few features that are worth knowing:
1. Consolidate Function - This nifty tool allows you to combine data from multiple tabs into a new summary tab, while maintaining the links to the original details. It requires data that is formatted exactly the same in each of the detailed tabs that you will be combining.
Create a new tab and then select the Consolidate function from the data menu - see example ribbon from Excel 2016

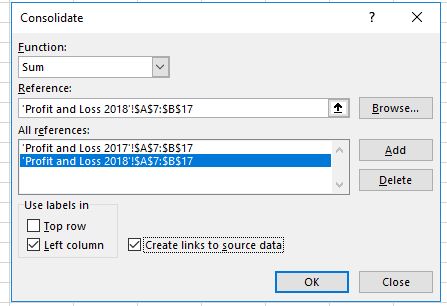
Here I am combining the revenue section of 2017 and 2018 P&Ls from QuickBooks Online - select the appropriate range of data on the source tab and then click the add button to drop it in the "All references:" window below. Continue adding ranges for each tab. If the range includes labels, note that in the checkbox provided. Be sure to check "Create links to source data" to maintain a live connection to the detailed tab.

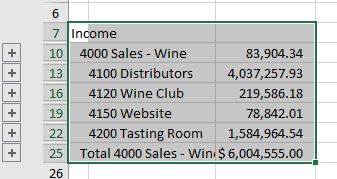
The result is a summarized, grouped table with information from each year.

When you might use: When you have a single tab for each DTC sales channel (Web, TR, Club, etc) showing sales by brand and by vintage and want to combine them into one summary total for the month. Or use this feature if you have separate locations with the same financial data (same chart of accounts) that you want to summarize.
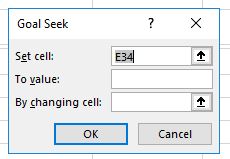
2. Goalseek - this feature lets you drive a desired outcome by calculating a desired input. Click on the What-if Analysis menu item on the ribbon, then select Goalseek from the drop down menu.

When to use: I used it on my ProfitEquationPlanner model for our LeCouRouge Winery to determine how many cases per buyer would be required to achieve a certain revenue goal. The two highlighted purple cells are the values that are related to each other.

When I enter a goal of $500,000 in revenue in the Goal Seek "To Value" field and point to the Case Cell highlighted in purple, Excel returns a value of 4.85 bottles needed to reach that sales target.

I can select OK to update my spreadsheet with the calculated value or undo the changes suggested.
Note: some features may require changes to your Options in Excel. If a feature is not visible on your ribbon, check your Options, Advanced, Add-ins and make sure The Analysis Toolpak and Solver Add-in are both selected. )